Overview
The topic for our project is “Pulse Map,” whose general goal is to create a tool for NYC dwellers to better manage their stress levels, which we hope will lead to more pleasant interactions and an increase in the overall emotional health of the city. The expected implementation process should be based on sensors and a geo-locator, which users can utilize to see their anxiety levels displayed on an interactive map.
Our goal is to lend transparency to which time/location may be triggering their anxiety, as well as patterns that they can be better prepared for. The device will take pulse/heart rate, as well as noise, temperature, humidity, brightness, and heat index into account.
Our goal is to lend transparency to which time/location may be triggering their anxiety, as well as patterns that they can be better prepared for. The device will take pulse/heart rate, as well as noise, temperature, humidity, brightness, and heat index into account.
Significance
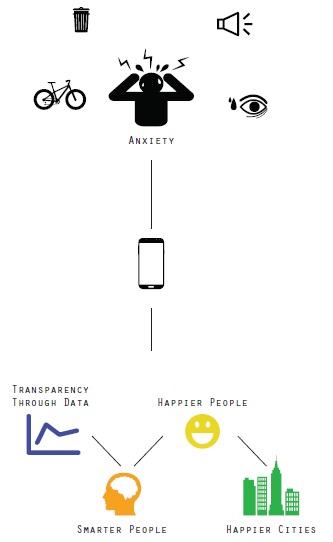
The purpose of NYC Pulse Map is to provide city dwellers a tool to track their everyday commute and ‘interactions’ with the City and its residents with regards to their heartbeat and environmental data such as temperature, humidity, noise and brightness. This information could be used on 2 different levels:
- Quantified Self component: User could potentially make informative decisions in his/her everyday life in order to mitigate stress or anxiety related to specific location. As a result he/she can be less stressed or anxious.
- Smart City component: Scaling the project among NYC users can possibly help city administration to identify areas and patterns that negatively contributes overall emotional health of the city. It can provide an evidence for introducing new solutions and policies to make city and its residents’ interactions much more pleasant.
Literature Review
It is intuitively understood that the more active a person is, the higher their heart rate will climb. But what effect do particular environmental factors have on heart rate? And, how does an elevated heart rate contribute to decision making.
In “Listening To Your Heart: How Interoception Shapes Emotion Experience and Intuitive Decision Making,” the authors write:
"Theories proposing that how one thinks and feels is influenced by feedback from the body remain controversial. A central but untested prediction of many of these proposals is that how well individuals can perceive subtle bodily changes (interoception) determines the strength of the relationship between bodily reactions and cognitive-affective processing. (Dunn et al. 1835-1844))"
By better understanding our environment, it seems we can make better decisions. If each citizen better understands how they react to their city, the healthier a city’s residents’ decisions might be.
“Noise interferes in complex task performance, modifies social behaviour and causes annoyance. “ ("British Medical Bulletin")"
The British Medical Bulletin cites a study done that researches the effects that noise has on social behavior and decision making. We decided to take this urban stimulus, along with factors that can act as powerful triggers in an urban environment like brightness, temperature, and humidity, to see which ones might have an effect on heart rate.
Significance
With the development of economy and society, the urbanization comes to be normal phenomenon around the world, the bad impacts caused by the urbanization and exploding cities should be the potential psychological problems, for examples, fury, depression and anxiety. Each of them will do bad impacts on people’s emotional health. And our project aims at providing a possible way for people to manage their anxiety level through detecting some physical index by sensors. The problem of overweighed anxiety is expected to be tackled by getting people be aware of and be warned with their anxiety level, and then take some corresponding measures.
The core concept of our project should be affective computing, it is a popular area with increasingly attention and has been researched around the world for several years. Affective computing is the study and development of systems and devices that can recognize, interpret, process, and simulate human affects. Detecting emotional information begins with passive sensors which capture data about the user's physical state or behavior without interpreting the input. The data gathered is analogous to the cues humans use to perceive emotions in others. The emotional information we focused in the project should be skin condition and pulse/heart rate, also the environmental factors will be considered in the implementation. As for some prior works of the affective computing, there are typical examples. The Cognition and Affect Project (University of Birmingham), Blue Eyes (IBM) and Affect Sensitive Human-Robot Collaboration (Vanderbilt University), these prior projects are all focused on affective computing and extract crucial information to support the emotional management and decision making.
The core concept of our project should be affective computing, it is a popular area with increasingly attention and has been researched around the world for several years. Affective computing is the study and development of systems and devices that can recognize, interpret, process, and simulate human affects. Detecting emotional information begins with passive sensors which capture data about the user's physical state or behavior without interpreting the input. The data gathered is analogous to the cues humans use to perceive emotions in others. The emotional information we focused in the project should be skin condition and pulse/heart rate, also the environmental factors will be considered in the implementation. As for some prior works of the affective computing, there are typical examples. The Cognition and Affect Project (University of Birmingham), Blue Eyes (IBM) and Affect Sensitive Human-Robot Collaboration (Vanderbilt University), these prior projects are all focused on affective computing and extract crucial information to support the emotional management and decision making.
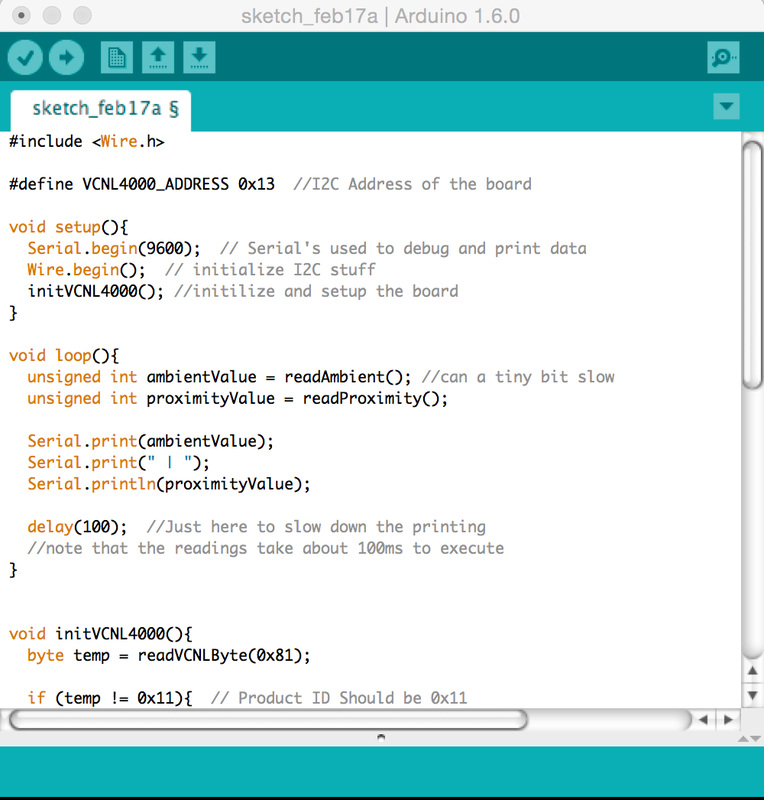
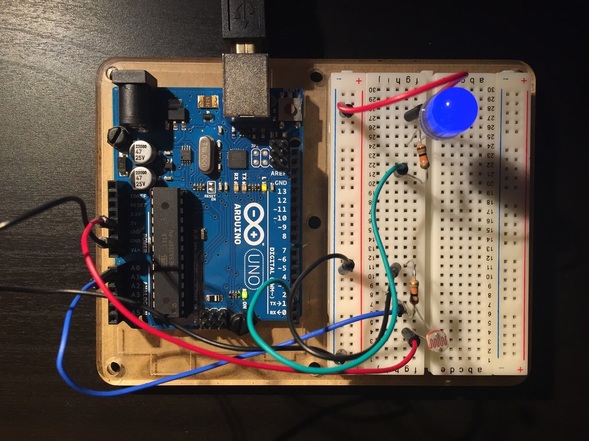
Instrument Deployment and Device Setup
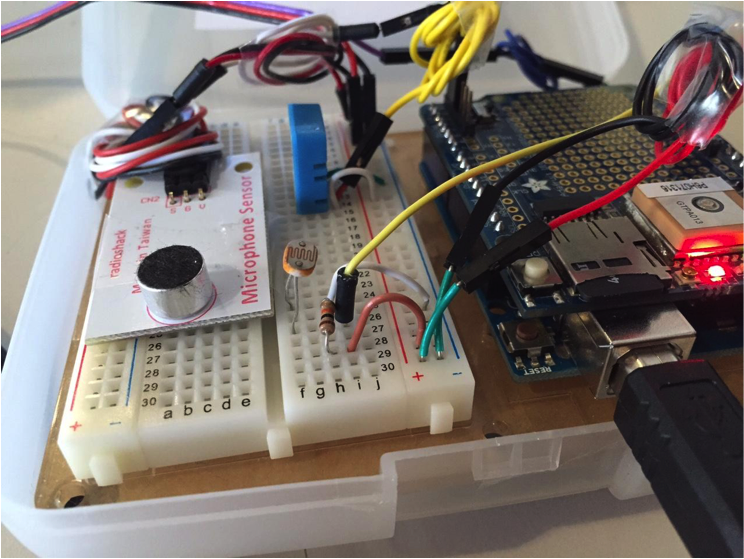
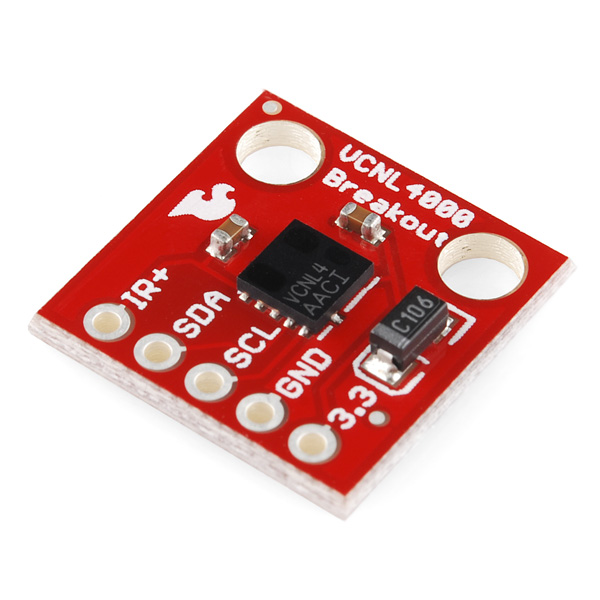
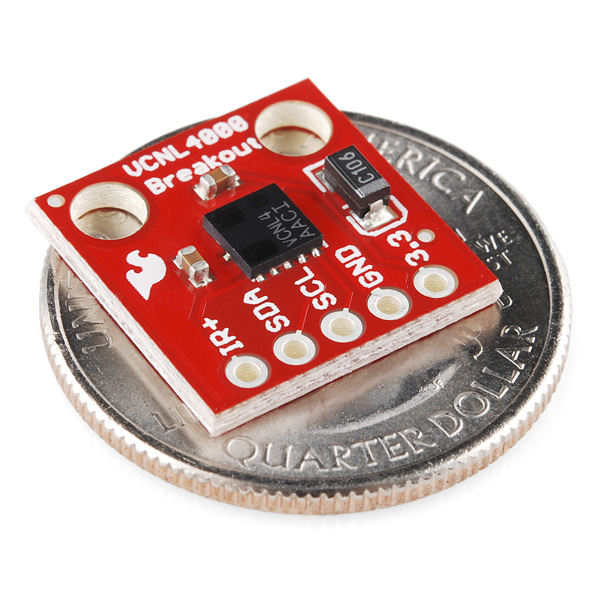
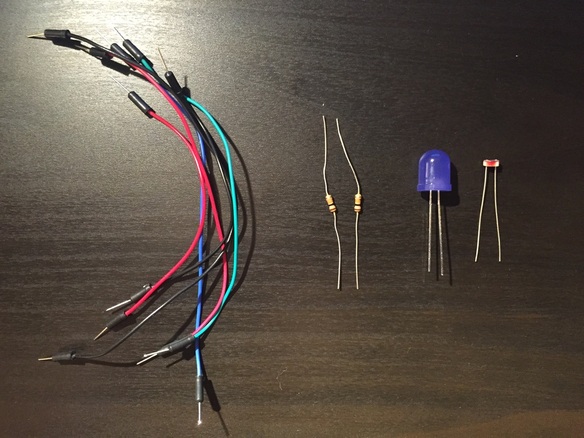
The components we used are listed below:
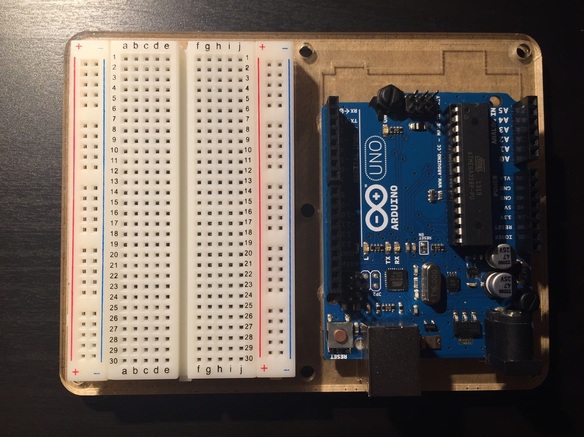
- Arduino Uno and bread board
- Electret Microphone Breakout (for environmental noise)
- Humidity and Temperature Sensor
- Photoresistor (for ambient light levels)
- Pulse Sensor (for heartbeat rate)
- Adafruit Ultimate GPS Logger Shield (for location and microSD storage)
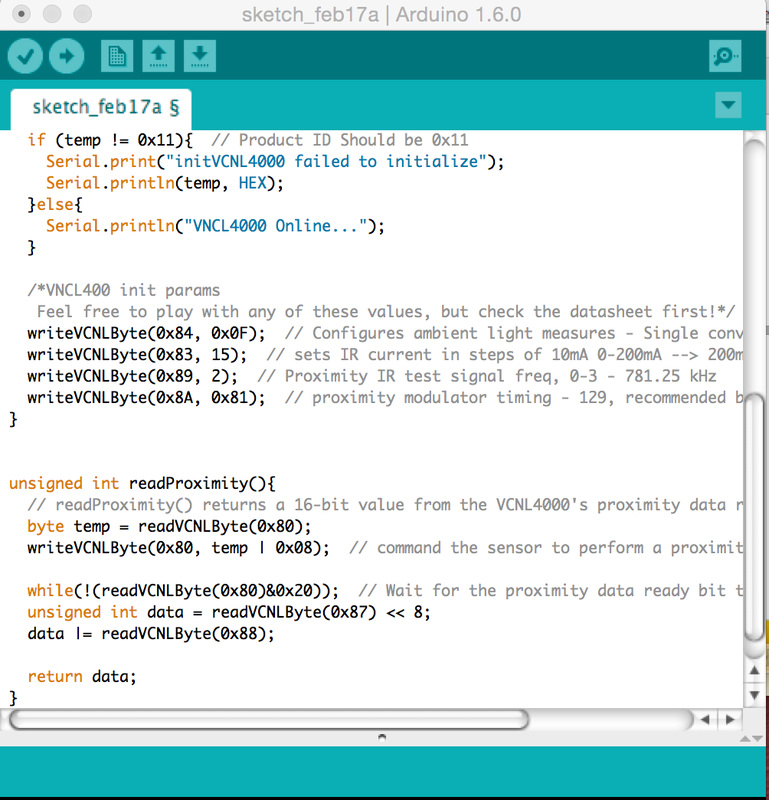
We have tried to make GPS shield work to get the location information, but we failed to get it working well but it can successfully store data into the SD card, we use the mobile app "FollowMee" to substitute the GPS shield and store the location information. Also, we did try to make an application with the bluetooth sensor, but we just couldn't get the iOS device work correctly, it should be our future goal to achieve the goal of GPS shield and bluetooth app to collect data from the mobile phone directly.
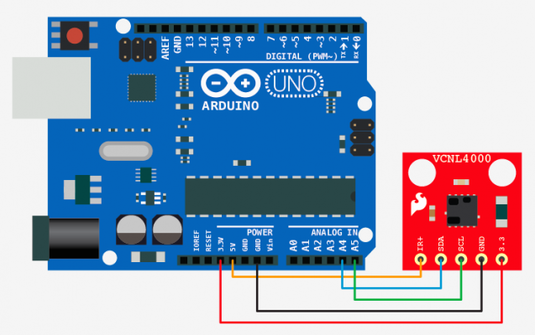
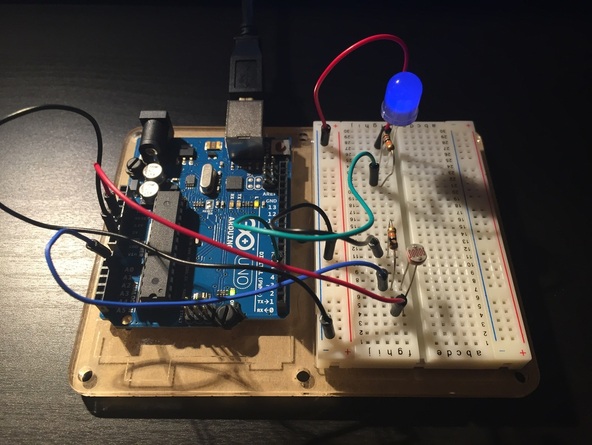
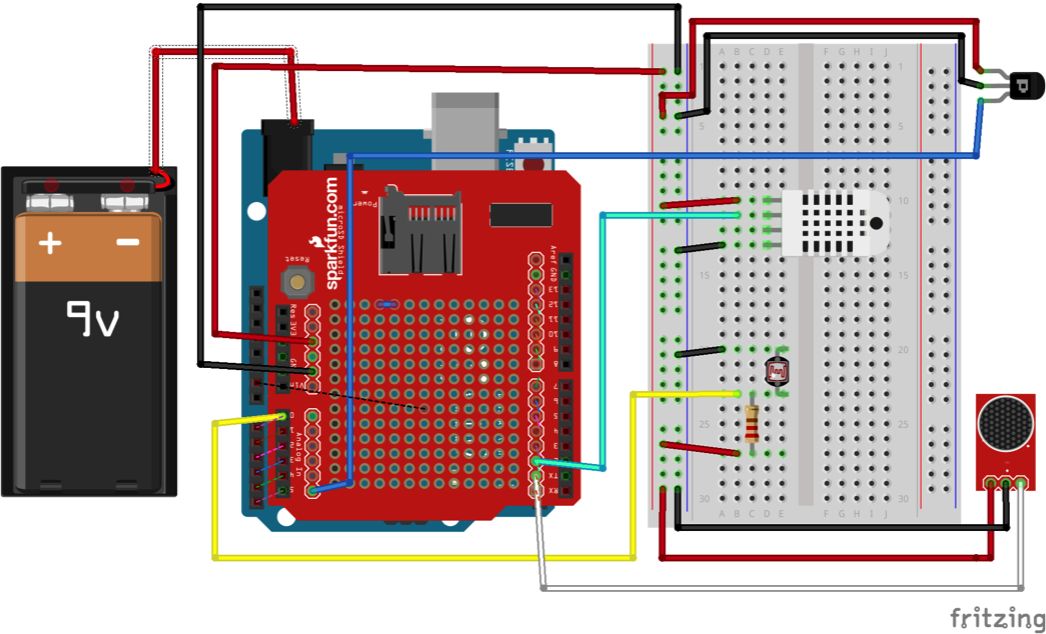
The diagram for the sensors system of Pulse Map:
The diagram for the sensors system of Pulse Map:
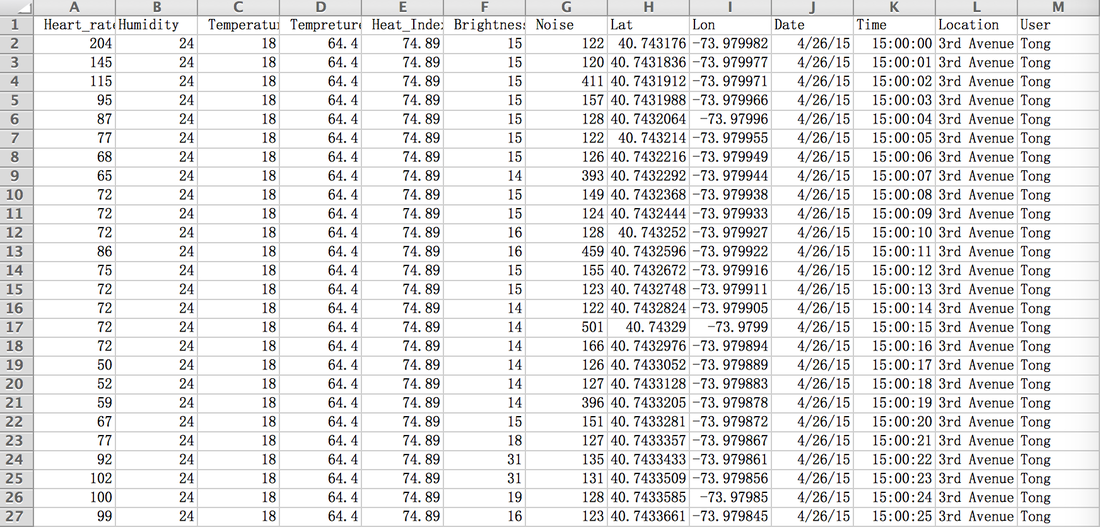
Data Collection and Visulization
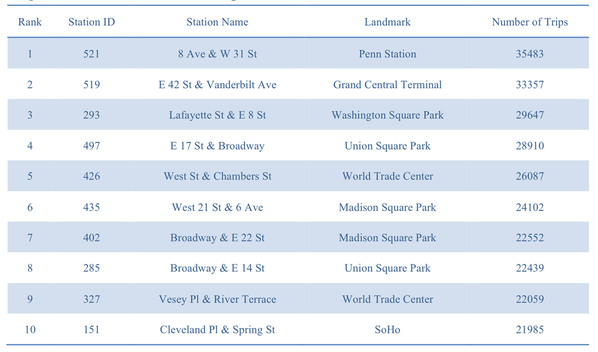
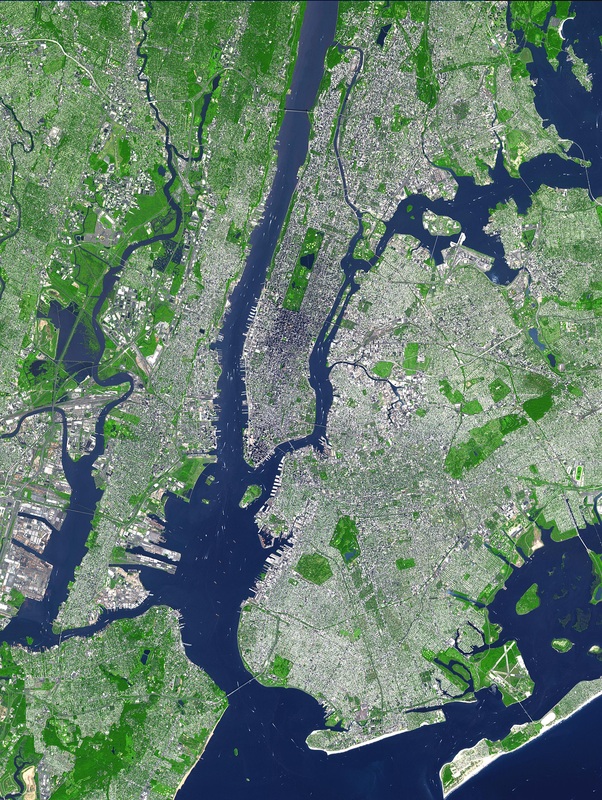
We collected the data separately in 3 days from different locations and time periods across Manhattan and Brooklyn, Subway Stations, Michael's home,3rd Ave, NYU, Bryant Park, Central Park, Ridgewood, Wall Street, Brooklyn Downtown and Times Square.
Data Visualizations
Data Visualizations
1. Statistical Overview
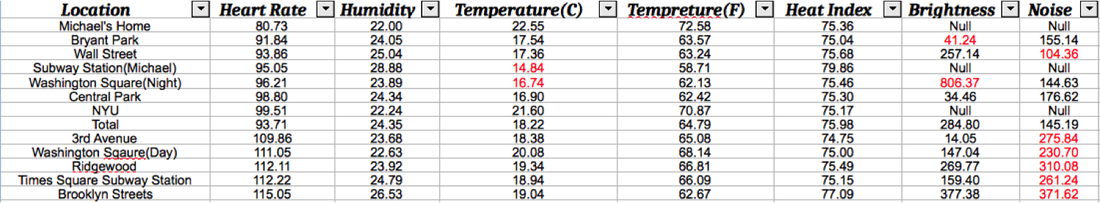
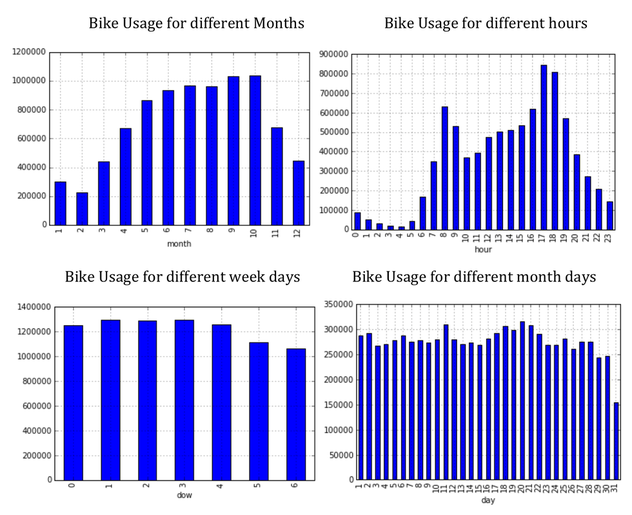
Based on different locations, we worked out the average data for each parameters of Heart Rate, Humidity, Temperature, Heat Index, Brightness and Noise. To explore the changing trend for each environmental factors and compare them with the heart rate value, the chart above listed out the average values from lowest heart rate to highest heart rate. To do some observations, we found that the increasing trend of BPM is similar as the noise level, it shows the bigger the noise is the higher the BPM is, it is just our assumption base on our data, we'll figure it out later.
2. The Contrast between BPM and Other Factors
2. The Contrast between BPM and Other Factors
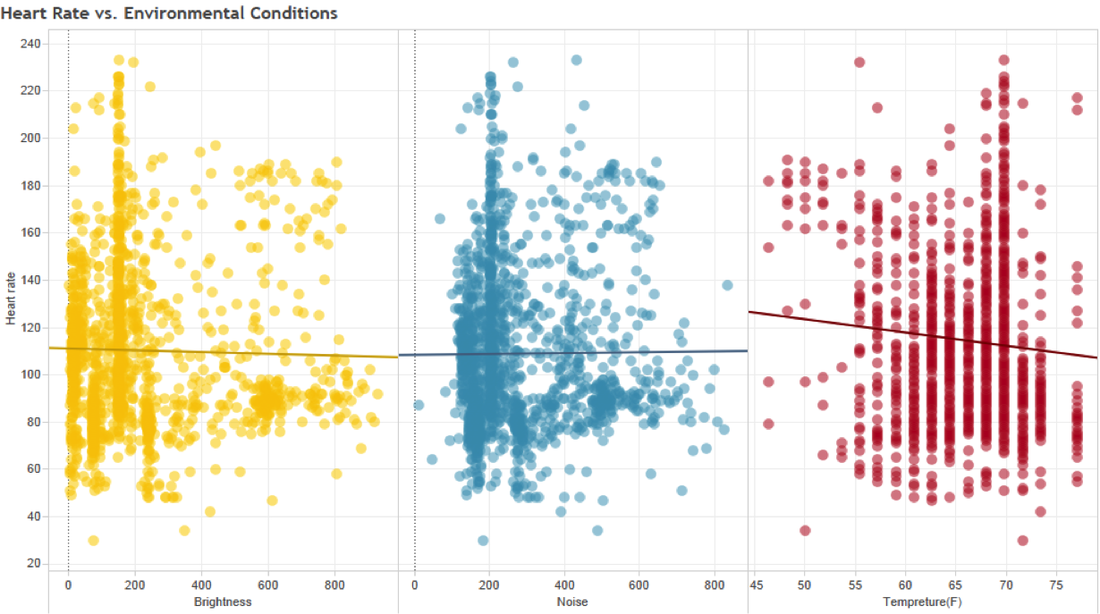
The data visualization shows the plot for the distribution of heart rate and some specified environmental factors. We generated a line to simulate the trend, but we don't think the line is persuasive, it is due the data collected is not enough to show the evidence.
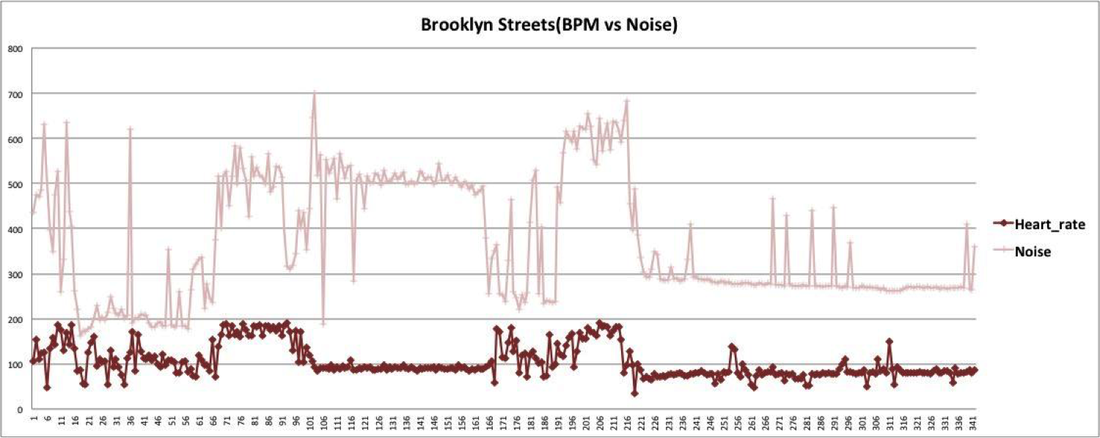
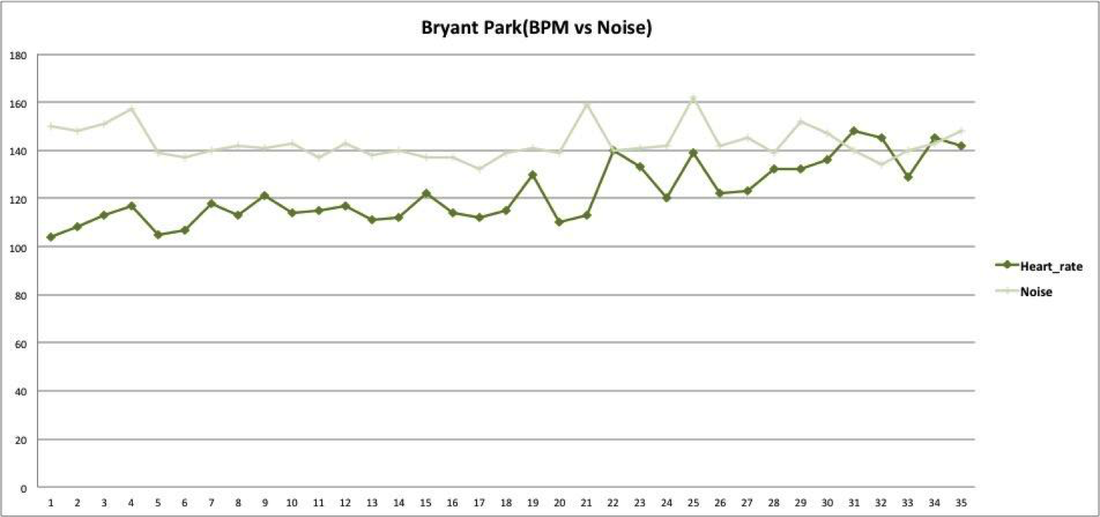
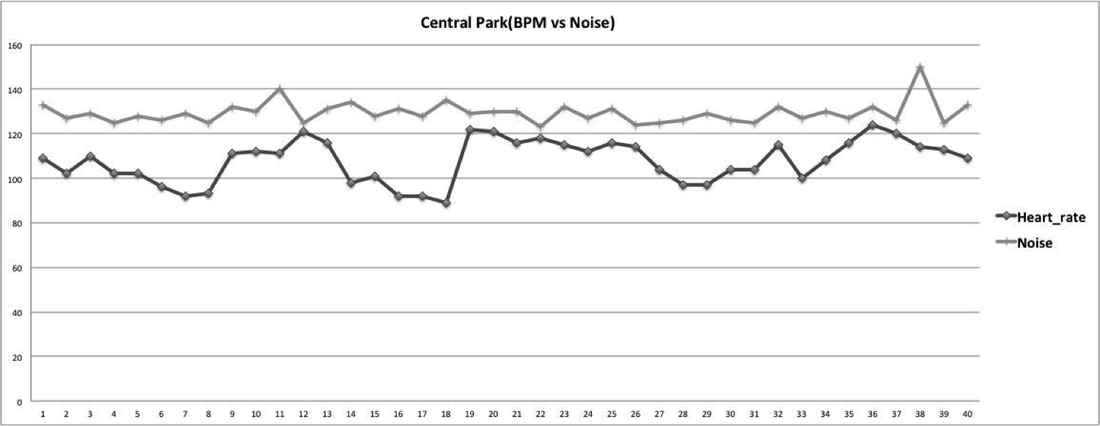
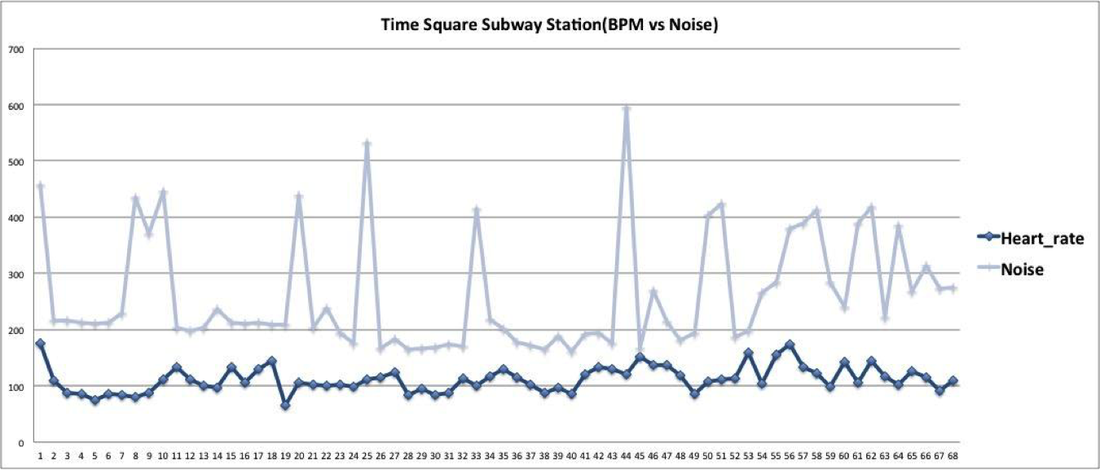
The four figures shown above we worked out is helping us find the possible relationships between BPM and noise level. Although we cannot say the relationship is definitely to be like some type, we can try to find some interesting phenomenon to give us future research directions. The most interesting thing we have found is that higher environmental noise level doesn't mean higher BPM, but big change for environmental noise level will cause a raise for the BPM, for example it could be reasonable if there appears a sudden noise. So our next steps should be collecting more data to evaluate this assumption.
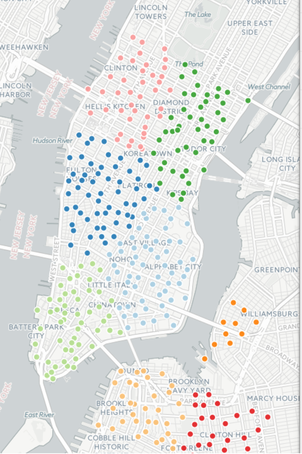
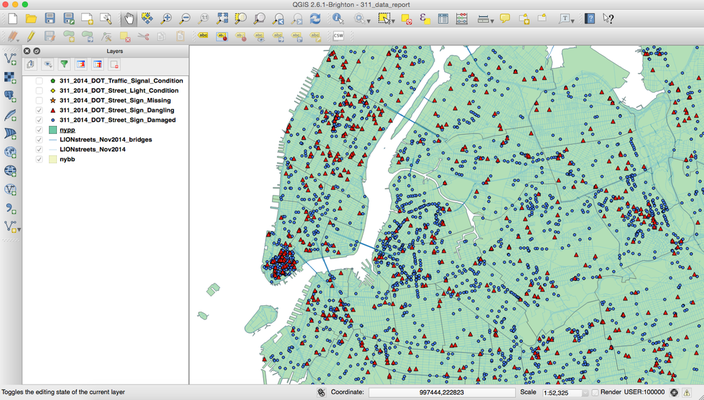
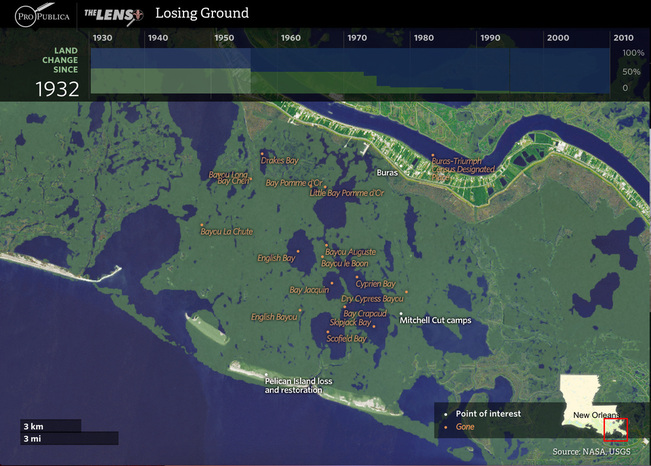
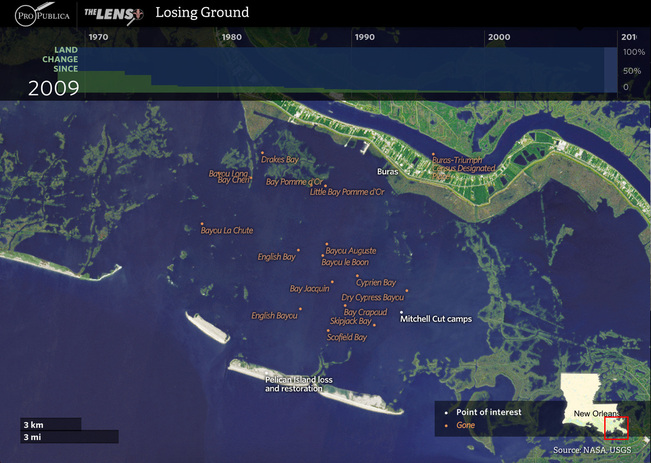
Data Mapping
Persona Stories
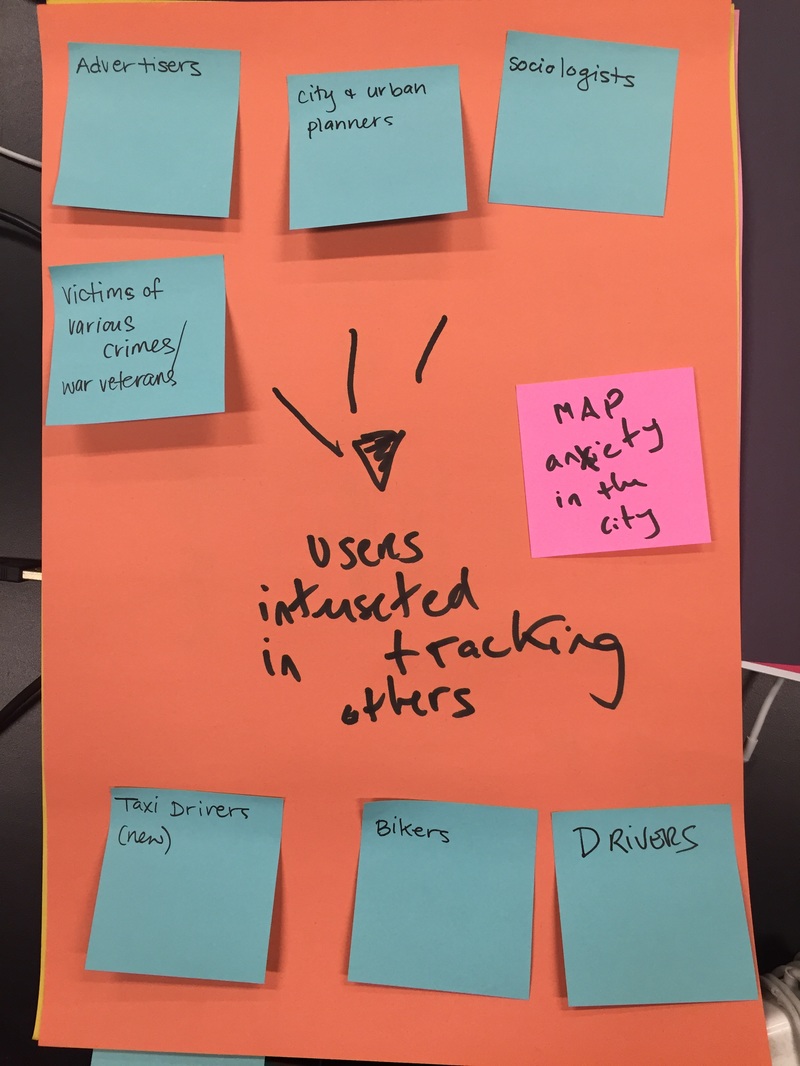
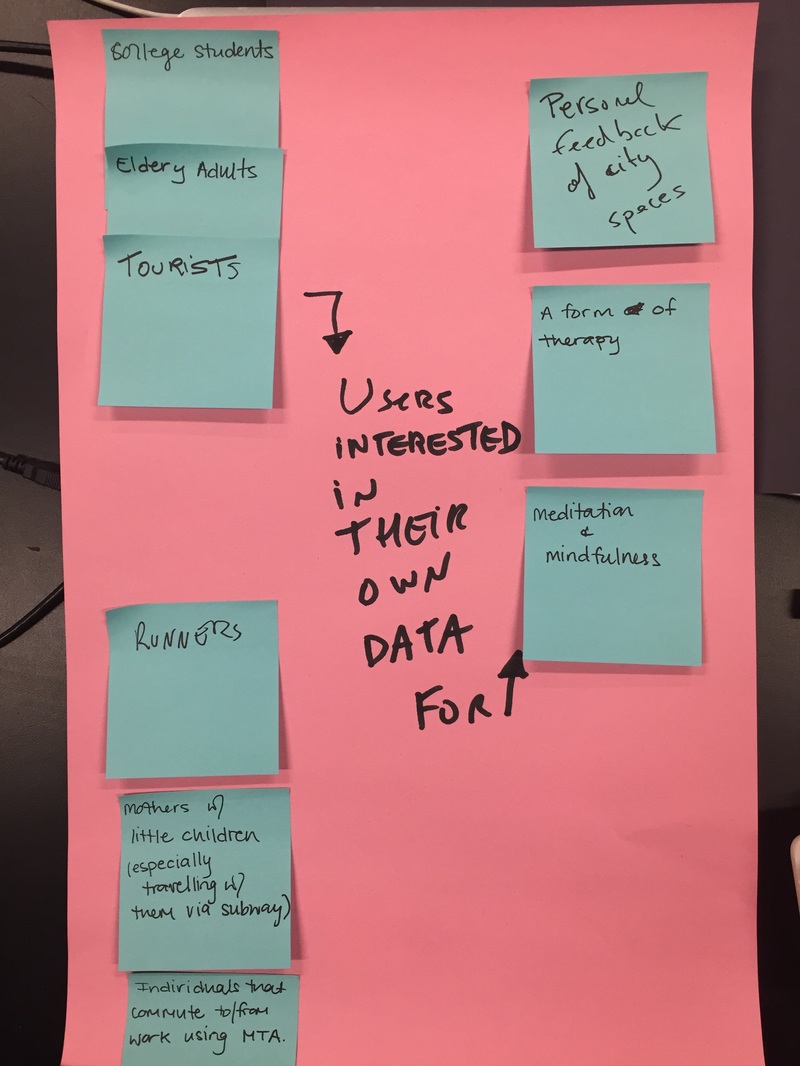
Our classmates were helpful in determining who the end users for our device may be.
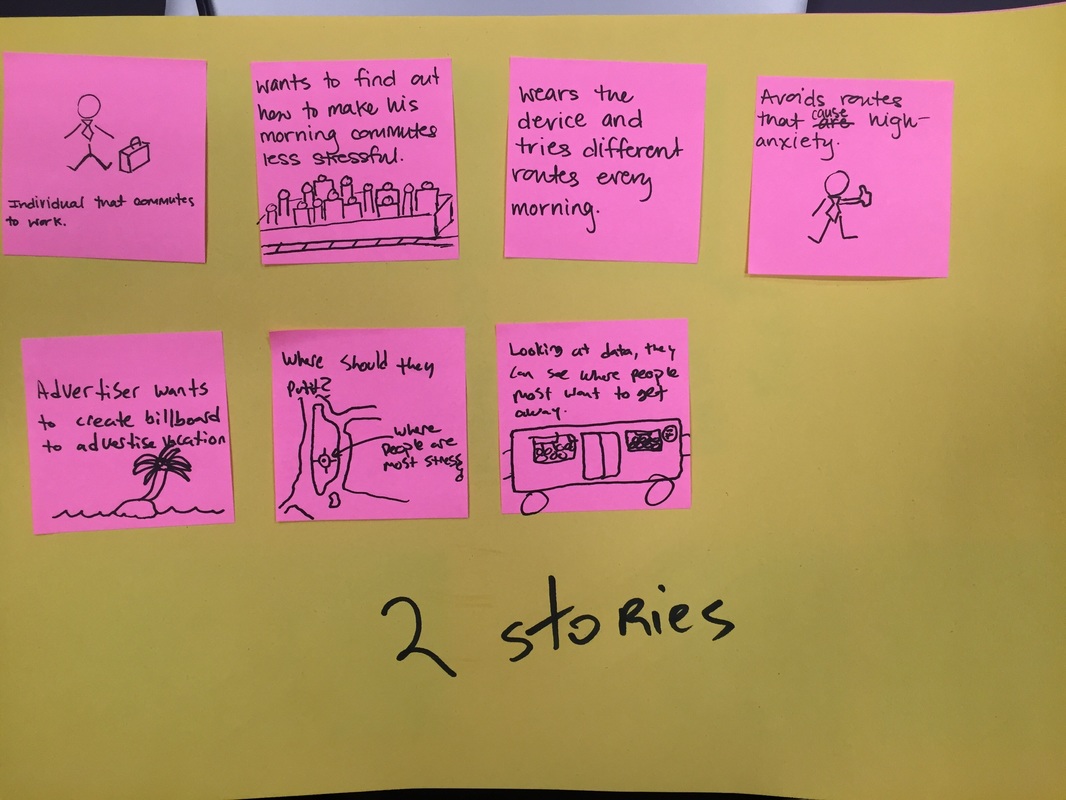
1.A commuter wears the device to determine how transportation affects their anxiety. After collecting data, they now know which subway lines to avoid or target.
We like this one because it speaks to the individual’s use within a larger urban context. This is very close to what we had in mind when we originally conceived on the project.
2. An advertiser wants to advertise a relaxing vacation package. They use the device to know which spots in the city are the most stressed out.
This was more interesting to us. We had not yet considered the commercial appeal of a device like our’s, but after seeing this user persona it seems obvious. It would be interesting to see how we could organize the data to most useful for an API or for advertisers.
Bibliography
- Dunn, B. D., H. C. Galton, R. Morgan, D. Evans, C. Oliver, M. Meyer, R. Cusack, A. D.
1835-844. Web.
- "British Medical Bulletin." Noise Pollution: Non-auditory Effects on Health. N.p., n.d. Web. 28
Apr. 2015.